






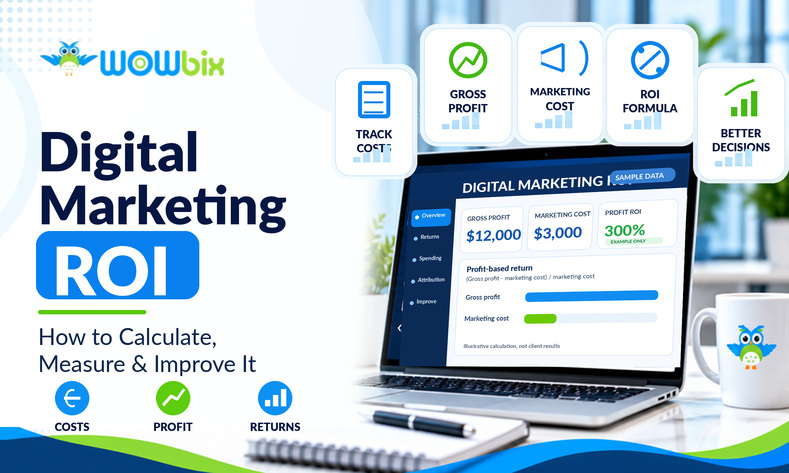
Digital marketing return on investment (ROI) measures the profit a business earns compared with what it spends on online marketing. The number only tells a useful story when the revenue, cost of delivering the product or service, marketing expenses and time period are all counted.
Profit based ROI (%) = ((Gross profit attributable to marketing − Total marketing cost) / Total marketing cost) × 100. If a campaign generates $12,000 of gross profit and costs $3,000 in marketing, the profit based ROI is 300%. That means the campaign generated $3 of contribution after marketing for each $1 spent on marketing, before any unallocated overhead or taxes.
This guide explains the digital marketing ROI formula, shows how revenue based calculations can exaggerate a return, and walks through service business, ecommerce and longer sales cycle examples. It also covers ROAS, acquisition costs, attribution, tracking setup and a 90 day measurement plan. Each example is hypothetical, not a result achieved by a Wowbix client.
What Is Digital Marketing ROI?
Digital marketing ROI compares the economic return from online marketing with its cost. Businesses use it to assess whether paid search, SEO, email, social advertising and other channels are producing enough value to justify the investment. A positive number can support a decision to continue or expand a campaign, but only when the inputs and the time period are clear.
The important word is profit. A service business may invoice $30,000 from new jobs, yet it still has to pay technicians, materials and other direct costs to deliver them. An ecommerce store must pay for inventory, fulfillment and returns. Those costs reduce the amount available to cover marketing.
The Digital Marketing ROI Formula
Revenue based return proxy (%) = ((Attributed revenue − Marketing cost) / Marketing cost) × 100.
Profit based marketing ROI (%) = ((Attributed gross profit before marketing − Total marketing cost) / Total marketing cost) × 100.
Gross profit before marketing = Attributed revenue × Gross margin, when one reliable margin applies to the sales being measured.
Marketing cost should include relevant media spending, agency or freelancer fees, creative production, software and internal labor where reasonably measurable. The definitions need to remain consistent between months and campaigns. The profit based version is a useful contribution measure; a complete company ROI analysis may need additional overhead, taxes and financing costs.
ROI as a Percentage and as a Ratio
ROI is often expressed as a percentage, while return ratios can describe either net gain or total money received. A 300% ROI means $3 of gain after the measured investment for each $1 invested, within the stated scope. It also means $4 in total return for that $1 when the return is calculated consistently.
A ratio presented without a definition may refer to net profit divided by investment or revenue divided by investment. Those are not interchangeable. Ask whether a claim measures revenue, gross profit, contribution after marketing or cash collected, and whether the original spend is included in the ratio.
Revenue ROI vs Profit ROI: Why the Difference Matters
Revenue based calculations can make a campaign look more profitable than it is. They subtract marketing expenses from sales while ignoring the costs required to complete those sales. The result is a revenue return proxy, not necessarily a profit return.
Consider a company that spends $3,000 to attract customers who purchase $30,000 of services. A revenue only calculation reports 900%. If delivering those services consumes 60% of revenue, gross profit is $12,000. Subtracting the same $3,000 marketing investment gives $9,000 of contribution after marketing and a 300% profit based ROI. The two calculations use identical customers and spending but answer different questions.
The gap matters most when products, projects or services have different margins. A replacement job with expensive materials may bring more revenue than a repair but leave a lower percentage of gross profit. Similarly, a store can sell more low margin inventory during a promotion without creating meaningful profit.
Use the actual margins for the orders or jobs attributed to marketing whenever possible. If exact job level margin is unavailable, identify the estimate and test a lower and higher margin assumption. Do not use a companywide average silently when marketing disproportionately attracts unusually low or high margin work.
Revenue also differs from cash collected. A commercial customer may sign a contract today and pay months later, possibly after costs have already been incurred. For financial decision making, decide whether the calculation uses signed contract value, recognized revenue, collected cash or forecast customer value. Label the choice and keep it consistent.
Profit based ROI remains an estimate when attribution is uncertain. A customer who came through paid search may already have intended to buy. The calculation should say “attributed” unless a test supports the stronger claim that marketing caused the sale. The worked examples below use simplified assumptions so the arithmetic is easy to audit.
ROI, ROAS, CPL, CAC, LTV, and Payback: Which Number Answers Which Question
No single marketing metric answers every business question. Return on ad spend evaluates ad revenue relative to advertising cost. Cost per lead describes inquiry efficiency. Customer acquisition cost describes the expense of winning a new customer. Lifetime value and payback place those costs in a longer customer relationship.
On mobile, swipe sideways inside the table to see all columns.
| Metric | Formula | Question answered | Caution |
|---|---|---|---|
| Revenue return proxy | ((Revenue – marketing cost) / marketing cost) x 100 | Revenue relative to marketing spend | Not actual profit |
| Profit based ROI | ((Gross profit – marketing cost) / marketing cost) x 100 | Whether gross profit covers marketing | Overhead and attribution may remain |
| ROAS | Attributed ad revenue / ad spend | Return of ad revenue per media dollar | Ignores gross margin and agency fees |
| CPL | Marketing cost / qualified leads | Cost of an inquiry | Not all leads buy |
| CAC | Acquisition cost / new customers | Cost to win a new paying customer | Exclude repeat and duplicate customers |
| LTV | Gross profit per customer during stated lifetime | Longer term customer value | Depends on retention assumptions |
| Payback | CAC / monthly gross profit per customer | Months to recover acquisition cost | Not suitable for irregular margins without adjustment |
| Close rate | New customers / qualified leads x 100 | Conversion of inquiries into customers | Qualifications must be consistent |
Return on ad spend (ROAS) is particularly useful when deciding which paid campaign to investigate next. But a high ROAS can still produce weak profit if gross margin is low or management expenses are substantial. ROI gives a broader cost and profit view, while customer acquisition cost (CAC) and lifetime value (LTV) help determine whether the business can afford to keep finding similar buyers.
Cost per acquisition (CPA) is used differently across platforms. Some advertisers mean cost per purchase or completed conversion, even when a conversion is only a form submission. In this guide, CAC specifically means marketing cost divided by new paying customers. Every dashboard should define what its acquired unit actually represents.
Lifetime value should also be treated carefully. If LTV is estimated as gross profit over the full customer relationship, use a clearly stated time horizon, repeat purchase pattern and retention assumption. Adding projected lifetime value to a campaign’s immediate revenue without documenting future costs can create an impressive but unreliable ROI number.
Payback period asks how long a customer takes to generate enough gross profit to repay its acquisition cost. It is especially helpful for recurring service contracts and B2B sales. A long payback may be manageable for a stable business with cash reserves and unacceptable for one that needs quick returns.
How to Calculate Digital Marketing ROI Step by Step
A reliable calculation begins with an exact definition of the outcome, then includes every relevant marketing expense and the direct cost of delivering the sale. It ends with a stated time period and a check against the sales records.
Step 1: Decide What Counts as a Return
Choose the outcome that has economic value: a completed service job, an ecommerce order, a signed contract with a defensible recognition method or a renewal. A quote request and a phone call are earlier steps, not cash returns by themselves.
Set a rule for cancelled orders, returned products, deposits, discounts and duplicate leads. If the campaign influences leads but sales are still pending, report pipeline value separately and avoid presenting it as collected revenue.
Step 2: Add Up All Marketing Costs
Gather ad spend from the platforms, agency or freelance invoices, creative production, paid tools, attribution software, campaign landing pages and any identifiable staff time. Include only costs relevant to the scope being measured. For example, a single campaign’s ROAS normally divides by ad spend, while an all in campaign ROI should include management and production costs.
When one expense supports multiple channels, allocate it using a stated rule. Do not charge all website maintenance to one paid campaign while excluding it from the others. A consistent allocation is better than a false claim of precision.
Step 3: Measure Revenue and Gross Profit From Those Customers
Connect leads and transactions to a source using analytics, call tracking and customer relationship management (CRM) data where available. Match an actual sale or completed job to its revenue, then subtract direct delivery costs or apply a relevant gross margin estimate.
A business with several service categories should calculate margin by category when possible. Marketing that attracts high value installations might have different economics from marketing for annual inspections. If the CRM only records an estimate amount, keep the number in a pipeline report until the outcome is known.
Step 4: Choose the Time Window and Say It
Decide whether the review covers a calendar month, quarter, year or a customer cohort acquired during a specific period. A campaign spending in January may produce sales in March. Mixing January costs with March sales and no explanation can produce a distorted ratio.
For long sales cycles, keep an acquisition period and a realization period. A report might show the cost of leads acquired in the first quarter and the revenue from those leads as contracts close. Record both dates rather than moving all the credit to the month a contract is signed.
Step 5: Calculate, Then Sanity Check
Run both the revenue proxy and profit based ROI formulas. Check whether the result changes significantly if margins are lower, fees are included or a longer window is used. If a report claims extraordinary ROI but contains no job values, direct costs or sales records, the number is not ready for a decision.
Keep the inputs in a simple worksheet. Use columns for source, dates, marketing spend, leads, new customers, revenue, gross margin, gross profit and notes on attribution. A transparent spreadsheet is more useful than a percentage nobody can reproduce.
Worked Examples With Real Arithmetic
All three examples are hypothetical and are not client results. Their inputs are deliberately simplified so the relationship between revenue, margin, marketing cost and the review period remains visible.
Example A: A Local Service Business
Hypothetical example, not a client result. A service company spends $2,000 on advertisements and $1,000 on management in one month. It receives 60 leads, books 12 paid jobs and collects an average of $2,500 for each job. Gross margin before marketing is 40%.
On mobile, swipe sideways inside the table to see all columns.
| Metric | Calculation | Result |
|---|---|---|
| Advertising | Given | $2,000 |
| Management | Given | $1,000 |
| Total marketing | $2,000 + $1,000 | $3,000 |
| Leads | Given | 60 |
| Cost per lead | $3,000 / 60 | $50 |
| Close rate | Given | 20% |
| Jobs | 60 x 20% | 12 |
| Revenue | 12 x $2,500 | $30,000 |
| Gross profit | $30,000 x 40% | $12,000 |
| Revenue return proxy | ($30,000 – $3,000) / $3,000 x 100 | 900% |
| Profit based ROI | ($12,000 – $3,000) / $3,000 x 100 | 300% |
| ROAS | $30,000 / $2,000 | 15.0 |
| CAC | $3,000 / 12 | $250 |
The revenue return calculation gives 900%, but the business has only $12,000 in gross profit before marketing. After the full $3,000 marketing cost, contribution is $9,000 and profit based ROI is 300%. The ad platform ROAS of 15.0 uses only the $2,000 media cost, which is why it looks different from the total cost analysis.
This example shows why a high sales number is not sufficient evidence of campaign profitability. A real company would also reconcile which of the 12 jobs were genuinely new, whether every job was completed and whether gross margin differed by service.
Example B: An Ecommerce Store
Hypothetical example, not a client result. An ecommerce campaign spends $10,000 on ads and attributes $40,000 in product revenue to the campaign. Its gross margin before advertising is 30%. The example assumes no additional marketing cost beyond the media budget, so actual all in ROI could be lower.
On mobile, swipe sideways inside the table to see all columns.
| Metric | Calculation | Result |
|---|---|---|
| Ad spend | Given | $10,000 |
| Revenue | Given | $40,000 |
| ROAS | $40,000 / $10,000 | 4.0 |
| Revenue return proxy | ($40,000 – $10,000) / $10,000 x 100 | 300% |
| Gross profit | $40,000 x 30% | $12,000 |
| Contribution after ads | $12,000 – $10,000 | $2,000 |
| Profit based ROI | $2,000 / $10,000 x 100 | 20% |
| Break even ROAS | 1 / 0.30 | 3.33 |
The 4.0 ROAS sounds strong. Yet at a 30% margin, only $12,000 of gross profit is available before advertising. Subtract $10,000 of ad spend and the remaining contribution is $2,000, a 20% profit based ROI. The break even ROAS on that simplified margin is about 3.33, leaving less room for fees, refunds or pricing changes than the headline ROAS suggests.
This example shows why the same ROAS threshold should not be applied to every product or category.
Example C: A Long Sales Cycle
Hypothetical example, not a client result. A B2B company spends $6,000 a month on marketing for 12 months, totaling $72,000. It wins four customers, each signing a first year contract worth $30,000. Its gross margin is 50%. It is assumed, only for this example, that every customer renews for a second year at the same margin and that no additional acquisition spending is required to obtain those renewals; ongoing servicing costs remain reflected in gross margin.
On mobile, swipe sideways inside the table to see all columns.
| Metric | Calculation | Result |
|---|---|---|
| Spend | $6,000 x 12 months | $72,000 |
| New customers | Given | 4 |
| Year one revenue | 4 x $30,000 | $120,000 |
| Year one gross profit | $120,000 x 50% | $60,000 |
| Year one ROI | ($60,000 – $72,000) / $72,000 x 100 | -16.7% |
| Two year gross profit | $60,000 x 2 (renewal assumption) | $120,000 |
| Two year ROI | ($120,000 – $72,000) / $72,000 x 100 | +66.7% |
| CAC | $72,000 / 4 | $18,000 |
| Monthly GP per customer | $30,000 x 50% / 12 | $1,250 |
| Payback | $18,000 / $1,250 | 14.4 months |
After year one, $60,000 of gross profit does not cover the $72,000 acquisition expense, so profit based ROI is negative 16.7%. If all four customers renew and contribute another $60,000 of gross profit without extra marketing spend, two year profit based ROI rises to 66.7%. The hypothetical payback calculation is about 14.4 months.
Real renewals are uncertain. Retention costs, account management, discounts, financing and lost customers can change this result. The example shows why a negative early ROI is not automatically a failed campaign, and why future revenue should not be counted as guaranteed.
What Is a Good Digital Marketing ROI?
There is no universal good digital marketing ROI percentage. The result has to clear the business’s break even point and fit its cash needs, margin, growth goals and acceptable payback period. A fixed benchmark copied from another industry cannot answer that.
Start With Your Break Even
Break even ROAS = 1 / Gross margin expressed as a decimal. At a 40% margin, the simple break even ROAS is 2.5. At 20%, it is 5.0. At 50%, it is 2.0. This formula assumes ad spend is the only acquisition expense and gross margin is measured before advertising.
For example, a 40% gross margin leaves $0.40 from each sales dollar before marketing. A business needs $2.50 in revenue to produce $1 in gross profit, enough to cover $1 of ad spend. Add management fees, creative work or expected returns and the required revenue per advertising dollar rises.
Break even should be calculated on the margin appropriate to the product or service sold. If one campaign attracts both lower margin maintenance jobs and higher margin replacements, use the actual sales mix or compare the categories separately. A company may also seek a return well above break even to fund overhead, taxes and future investment.
What Published Benchmarks Do and Do Not Tell You
Many marketing guides repeat broad fixed return ratios without a clear study behind them. Such rules may serve as talking points, but they are not reliable targets for a specific business. A published number is meaningful only when its source, sample, date, calculation and business context are known.
A 2025 Litmus State of Email survey of nearly 500 marketing professionals reports that 35% of respondents saw $10 to $36 returned for each $1 spent on email, 30% reported $36 to $50, and 5% reported more than $50. These are self reported ranges for email marketing, not a universal net profit ROI or a prediction for a new campaign. The same page says 21% of marketing leaders do not measure email ROI.
In HubSpot’s 2026 marketing channels research, 30.2% of surveyed B2B marketers named website, blog and SEO among their highest ROI channels, with email at 23.6% and paid social at 23.3%. Those percentages describe how often a channel was selected as a leading performer, not the ROI earned by that channel. Converting a survey share into a return percentage would misrepresent the research.
The better benchmark is a business’s own reliable history. Compare gross profit return over consistent periods, account for different customer acquisition cycles and document anything that changes the calculation. If the baseline is unreliable, fix measurement before setting a target.
How to Track Digital Marketing ROI Accurately
Tracking accurate ROI requires more than installing a website analytics tag. A useful setup follows the customer from first inquiry through qualification, sale and actual revenue, and it keeps a consistent record of campaign cost.
Set Up GA4 Key Events and UTM Parameters
Google Analytics 4 (GA4) records actions as events. A key event marks an interaction important to the business, such as a confirmed form submission, qualified booking or completed purchase. Google’s current documentation distinguishes these key events from conversions used to measure and optimize Google Ads. Marking every page view or phone number tap as a successful lead can inflate the report.
Test the event in the live tracking setup and check that it fires only on the intended success action. A thank you page that anyone can open is not proof a form was submitted. Where practical, use a real successful form event or server confirmation. For phone inquiries, explain whether the event measures a tap, an answered call or a qualified caller.
Urchin Tracking Module (UTM) parameters are labels attached to campaign URLs. Use consistent names for source, medium and campaign, then document the naming rules. For example, a paid email link should not be marked as organic search. Avoid inserting inconsistent values that split one campaign across several reports.
Search Console and GA4 solve related but different problems. Search Console reports Google search impressions, clicks and queries; GA4 measures on site activity and key events. This distinction is explained in Wowbix’s Search Console versus Google Analytics guide. Neither tool knows the profit on an offline plumbing job unless the sales system supplies that information.
Track Phone Calls and Form Fills
Service businesses often receive more valuable calls than online purchases. Call tracking can attribute an inquiry to a channel or landing page, but the business must keep its public phone number stable and understand how dynamic number insertion works. Track the source, call date, whether someone answered, the service requested and whether an appointment was made.
A 60 second call is not automatically a new customer. It may be an existing customer, a vendor, spam, a billing question or a lead who lives outside the service area. Review call quality using a consistent definition. When recording calls, follow applicable notice, consent and privacy rules.
Website forms should record a durable lead identifier and preserve useful source details when consent and technical capabilities allow. A form event in GA4 is a useful milestone; it does not prove the lead was qualified or became a job. For businesses with weak conversion paths, the separate Wowbix guide to why a website is not generating leads covers the diagnosis rather than ROI math.
Connect Leads to Closed Revenue in Your CRM
A customer relationship management system (CRM) should connect an inquiry with its later outcome. Useful fields include first contact date, original source, campaign, service requested, assigned salesperson, qualified status, estimate sent, job booked, completed revenue and gross margin where available.
Use a shared lead identifier across systems where permitted, or reconcile records by a controlled matching process. For businesses using offline conversion imports, the event sent back to an advertising platform should represent a meaningful stage with correct value and timing. A booked appointment is a different action from a completed and paid job.
Do not erase leads that fail to close; they remain part of the acquisition cost and close rate calculation. If ten leads were generated and only two become customers, the cost of all ten belongs in the cost of those two acquisitions under a comparable campaign view.
Reconcile Platform Reports With Your Own Numbers
An ad platform may report conversions it attributes to an ad interaction. GA4 may assign value across channels under an attribution model. A CRM may show only revenue actually completed or paid. The three systems can legitimately show different figures because of reporting windows, models, time zones, duplicate handling and missing user consent.
Choose a source of truth for completed revenue, normally accounting, ecommerce or approved CRM records. Use GA4 and ad platforms to explain journeys and marketing credit, not to override reconciled financial records. Record the attribution logic next to the dashboard so the business understands what each number represents.
A practical monthly reconciliation matches marketing spend to the campaign, reviews leads, finds won customers and sums the gross profit from completed work. Investigate gaps instead of force fitting every platform number to match another. Make adjustments explicit when a sale is returned, cancelled or discounted after the reporting date.
Attribution: Who Gets Credit for the Sale?
Attribution determines which marketing touchpoints receive credit for an action. A last click model gives credit to the final eligible marketing interaction. A first click approach would credit the earliest. Multi touch methods distribute credit across several interactions.
As of November 12, 2026, Google Analytics documentation describes data driven attribution, paid and organic last click, and Google paid channels last click in attribution reports. Google states that first click, linear, time decay and position based models were removed from GA4 in November 2023. The default reporting model can be configured, and different reports and dimension scopes may use different attribution rules.
Consider someone who finds a company through SEO, returns from a paid search ad and calls after seeing a referral. Last click may overstate the final channel’s role while hiding earlier work. Data driven attribution may distribute credit differently, but it still relies on the observed interactions and platform rules.
Attribution is not the same as incrementality. Incrementality asks how many purchases would not have happened without the campaign. To investigate it, a business might compare similar regions or customer groups where advertising was and was not shown, while controlling for seasonality and demand as much as possible. A small business may lack enough data for a strong experiment, and stopping campaigns can create its own costs.
Because platform attribution assigns credit rather than proving cause, use the word attributed in ROI reports unless the business has a credible experimental or other causal basis for a stronger statement. The purpose is to improve decisions, not to award perfect credit to every channel.
How Long Before Digital Marketing ROI Shows Up?
Digital marketing ROI can appear at different speeds because the channel, sales process and delivery costs are different. A paid search campaign may generate inquiries soon after launch, but the business still needs time to qualify, close and complete the work. Organic SEO and content can require sustained improvements before producing material business outcomes.
For recurring services and B2B projects, the first contract may not recover the acquisition investment. Renewals can improve total customer economics if the customer stays and continues generating gross profit. That is why payback and cohort reporting should accompany a short period ROI number.
A useful distinction is between an activity milestone, a search or traffic indicator, a qualified inquiry, a signed job and a completed sale. None should be presented as the next stage without evidence. An initial traffic increase can be encouraging without proving that the marketing investment has paid back.
Wowbix’s article on how long SEO takes in New Jersey describes progress windows based on its experience. Those are agency observations, not a controlled study or a deadline that every website will meet. The ROI review should use the actual acquisition and sales dates instead of relying on a generic timeline.
A business that needs near term cash should examine the financial cost of waiting for a return. A business with a long customer lifetime may choose a longer payback if financing and retention assumptions support it. Neither choice makes an unsourced ROI guarantee acceptable.
How to Measure ROI by Channel
Different marketing channels need different supporting records, but the same core profit principle applies to all of them. The table below shows what to count, how the return may lag and where reports commonly go wrong. It intentionally avoids unsupported average channel ROI percentages.
On mobile, swipe sideways inside the table to see all columns.
| Channel | Return to count | Timing | Reporting pitfall |
|---|---|---|---|
| SEO | Gross profit from organic search customers | Accumulates with discovery and closing | Traffic mistaken for profit |
| Paid search | Gross profit from attributed jobs | Leads may be quick; closings lag | ROAS ignores management cost |
| Paid social | Profit from customers sourced to social ads | Varies by offer and demand | View through credit mistaken for causation |
| Profit from purchases and renewals | Depends on list and nurture | Returning customer double counted | |
| Content | Profit from influenced customers | Builds with readership and demand | Assists ignored or double counted |
| Local SEO / GBP | Profit from local calls and bookings | Depends on demand and service capacity | Every call treated as a job |
For search engine optimization, assess the gross profit from customers attributed to relevant search discovery over a defined period, including the cost of content, technical work and management. Impression and ranking changes are supporting indicators, not return. For paid campaigns, platform ROAS can help compare ad groups, but contribution after media and other marketing costs is the stronger financial check.
Local marketing deserves additional care because online actions often end as offline revenue. A Google Business Profile call may become a service appointment through dispatch, while a request for directions may not produce any customer at all. The business must avoid counting all interactions as completed transactions.
Email and content often influence people who later return through another channel. Avoid treating a platform assigned sale as proof that no other marketing contributed. Use consistent windows and look for completed sales, repeat business and the costs of maintaining the channel.
Why Digital Marketing ROI Is Hard to Measure, and What to Do Anyway
Customers rarely move through a perfectly documented single channel path. They may see a social post, search for the company, read a review, call directly, return to the site and speak to someone before buying. Some of those steps may be missing from analytics because of consent, device changes or offline conversations.
Word of mouth and brand familiarity create another complication. A campaign may make the company more memorable without generating a measurable last click. Equally, a customer may have purchased without the campaign, even if a platform assigns the final sale to an ad. That is why the business should avoid describing attributed revenue as confirmed incremental revenue.
Search discovery also changes as AI answers summarize information without always sending an identifiable click. Google Analytics introduced an AI Assistant channel for recognized assistant referrals in May 2026, but these reports do not capture every mention or the effect of an answer that produces no website visit. Track supported referral traffic while acknowledging what is invisible.
Practical supporting signals include branded search trends, direct visits, qualified inquiries, repeat customers, referral questions and a consistent “How did you hear about the business?” field. These are imperfect but useful checks when they agree with completed job data.
Measure uncertainty rather than hiding it. If 20% of CRM records have no known source, report that coverage gap. If customer value is estimated, label the assumption and revisit it when more actual invoices are available. An honest range is more useful than a single precise but unsupported ROI percentage.
A 90 Day Measurement Plan
A 90 day plan gives owners a way to improve tracking without pretending that every campaign will become profitable within 90 days. The first goal is trustworthy inputs; the second is a repeatable decision process.
Days 1 to 14: Define the Return and Fix Tracking
Choose the final outcome that counts as revenue, decide how refunds and incomplete jobs are handled, list direct costs, and map every marketing fee. Confirm GA4 key events, consistent UTM naming, call tracking and an original lead source field in the CRM. Test forms and calls with real controlled examples. Record who owns each account and tracking number.
Days 15 to 30: Capture the Baseline
Record lead counts, call quality, qualified inquiries, customer close rate, average completed job value and gross margin. Gather spend from every channel and make a list of customers already in the pipeline so later reports do not silently treat them as newly acquired. Separate historical data gaps from new campaigns.
Days 31 to 60: Reconcile the Funnel
Review samples of leads from each source. Are phone calls classified correctly? Can completed revenue be matched to qualified leads? Are new and repeat customers separated? Fix inconsistent naming and duplicate records before increasing budgets simply because an ad platform reports more conversions. Review sales follow up and missed calls alongside campaign performance.
Days 61 to 90: Make the First Financial Review
Calculate revenue return and profit based ROI for the mature sales already attributable to the period, then assess CAC, break even ROAS and payback where applicable. For leads still open, report pipeline value separately. Decide which channels to maintain, test or reduce based on actual business capacity and confidence in the data, not a single dashboard number.
If the measurement setup remains unclear, a free strategy discussion with Wowbix can be used to identify which reporting records are available and what still needs verification. It is not a promise of a particular result.
WOWBIX · PERFORMANCE MEASUREMENT
Know which marketing results you can actually measure.
Review your lead tracking, revenue records and reporting gaps before making bigger spending decisions.
Red Flags in a Marketing ROI Report
A good ROI report allows the business owner to reproduce the calculation and understand its limitations. That standard should apply to reports from every provider, including Wowbix.
- Website visits, impressions or ranking changes are described as ROI even though no sale value or marketing cost is provided.
- The report shows revenue and advertising spend but omits delivery costs, management fees or creative production from a claim of net profit.
- The date range is missing, or costs and sales are taken from different periods without explaining the lag.
- A platform’s assigned conversions are treated as confirmed new customers, while call quality and CRM outcomes remain unchecked.
- Several channels claim credit for the same sale and the report adds the claims together without removing double counting.
- There is no baseline, margin assumption, customer value definition or accounting adjustment for refunds and cancelled jobs.
- Percentages appear without the dollars behind them, and screenshots omit the dates, sources or settings needed to interpret the numbers.
- The provider says a particular channel caused revenue even though the evidence only shows attribution or a simple before and after change.
A credible report should show the numerator, denominator, scope, assumptions and follow up actions. It can be concise. A business should not need to accept an unexplained percentage just because it appears in polished presentation slides.
How Wowbix Measures Results
Wowbix’s public SEO pricing and service information describes ongoing reporting, Google Search Console and keyword monitoring as part of its SEO approach. Those are useful visibility measures, but they are not in themselves financial ROI. The business must still connect qualified inquiries to actual revenue and costs.
A marketing review should distinguish what Wowbix can measure through a website or campaign account from what a client must supply through invoicing, booking and customer records. This guide does not present any Wowbix client figure as proof of ROI. A contractor or business owner can review the reporting questions in this article before speaking with any agency.
Frequently Asked Questions About Digital Marketing ROI
What is digital marketing ROI?
Digital marketing ROI compares the profit attributable to online marketing with the total marketing cost. It is typically presented as a percentage. A useful calculation subtracts the direct cost of delivering products or services before describing the result as profit. Without that step, the number is a revenue return proxy, not necessarily net financial gain.
How do you calculate digital marketing ROI?
First identify revenue from customers attributable to marketing and calculate the gross profit from those sales. Then subtract the relevant marketing cost and divide by that marketing cost. Multiply by 100 to get a percentage. State the time period and assumptions, especially if sales are delayed or customer values are estimated.
What is a good ROI for digital marketing?
A good ROI covers the investment and meets the company’s required profit and payback goals. There is no reliable universal target for every industry. Gross margin, additional marketing fees, repeat purchases and the time needed to close a sale change the answer. Use actual financial records to set a defensible threshold.
What is the difference between ROI and ROAS?
Return on ad spend, or ROAS, is attributed advertising revenue divided by advertising spend. ROI measures profit or contribution after relevant expenses compared with the investment. An ad campaign can have high ROAS but disappointing ROI if products have low margins or the business pays substantial management and delivery costs.
How long does it take to see ROI from digital marketing?
The timeline depends on the channel, sales cycle, margin and when the business collects revenue. Paid campaigns can generate inquiries before those leads close into sales, while SEO and content work may take longer to produce qualified demand. Review leading indicators early and completed profit over a period that matches the customer journey.
Why do Google Ads and Google Analytics show different numbers?
Google Ads and GA4 can use different attribution settings, dates, conversion definitions and reporting methods. A phone call event may also be different from a qualified booked customer. Compare the underlying event, time zone, counting method and attribution window before reconciling figures against the CRM and completed revenue records.
Can you measure the ROI of SEO or brand work?
Yes, but the result usually involves assumptions and incomplete attribution. Track the cost of SEO or brand activity, relevant search and inquiry signals, then qualified customers and gross profit over a stated period. Keep estimated influence separate from revenue that can be traced directly to the work, and avoid promising causal certainty.
How often should ROI be reviewed?
Review tracking quality and leading indicators regularly, with a monthly operating review often useful for campaign management. Financial ROI should be assessed over periods that capture the real sales cycle and completed customer value. For longer B2B contracts, supplement monthly reports with quarterly or cohort based reviews rather than expecting every lead to close immediately.
Next Steps
Digital marketing ROI becomes useful when the calculation connects marketing expense, real customer revenue, gross margin and an honest time window. Start with the last completed quarter: gather total costs, identify customers and calculate profit based ROI using Example A as a template. Then review the missing data before changing budgets.
For businesses that want to discuss whether their tracking setup supports a meaningful ROI calculation, contact Wowbix for a free strategy call. The goal is to understand what the numbers show and what still needs checking, not to promise a return.
WOWBIX · PERFORMANCE MEASUREMENT
Make marketing decisions with clearer numbers.
Share your website, goals and current tracking. Wowbix can help identify what the data supports and what needs more work.